Graphs and Charts
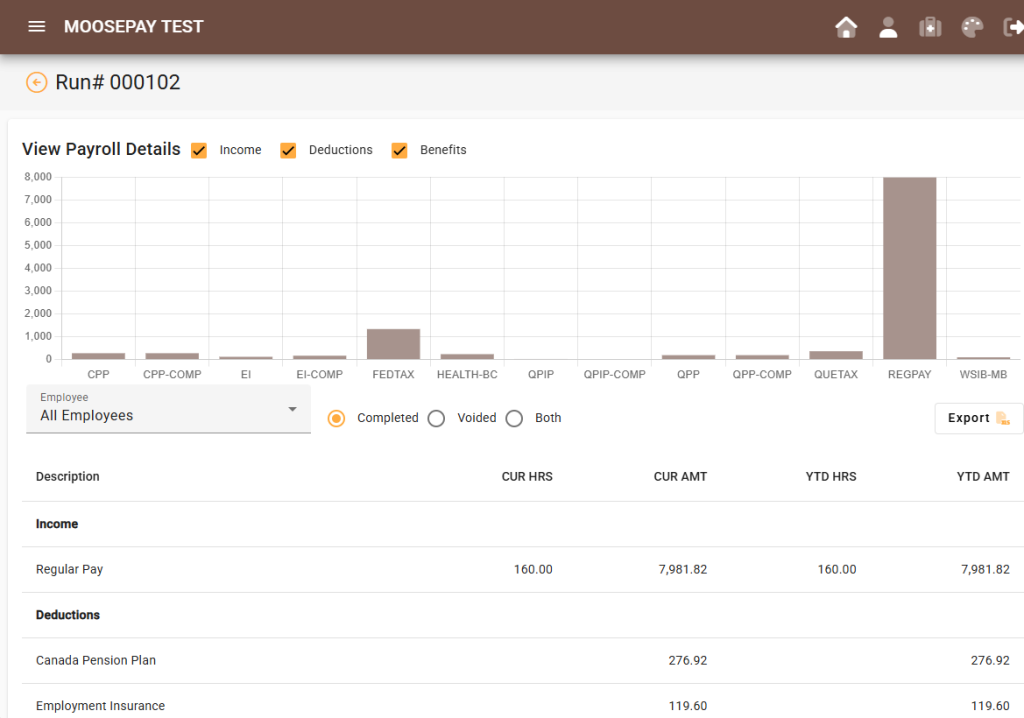
MoosePay can not only produce reports, but dashboards, charts and graphs are also part of the system. To get a visual representation of your data is quite easy to do, many screens show this information automatically. Simply pick the year and filters and “voila” a visual representation appears.
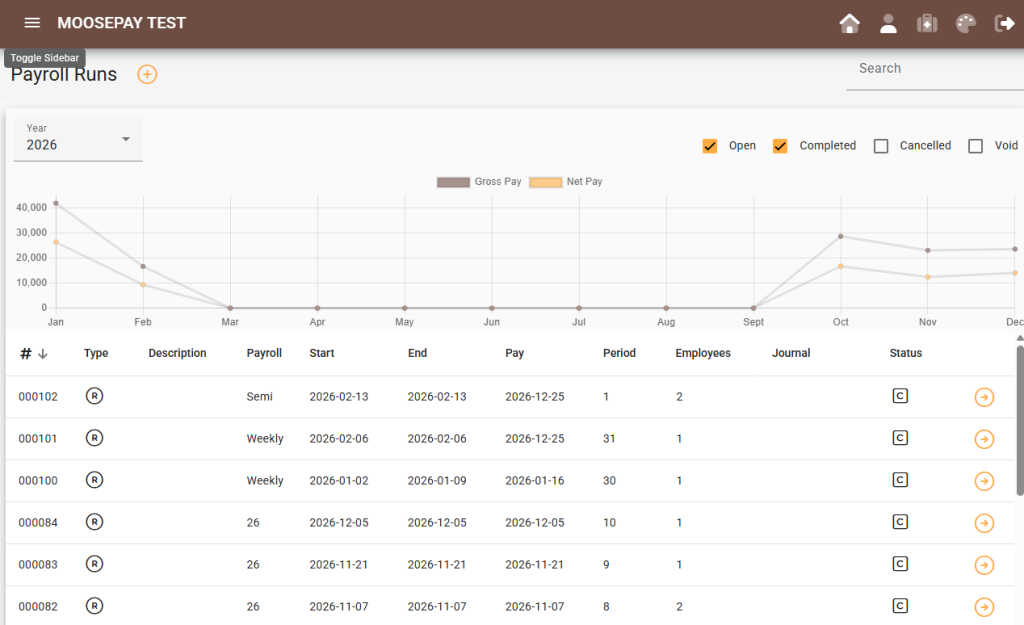
Whether you are looking into employee history, or reviewing a one-off pay run, drilling down is easy to do, or a simple graph may give you just what you need. Either way, the choice is yours.